A Case Study of Brottspejl at Sveriges Television (SVT)
by Ester Appelgren and Gunnar Nygren
1. Introduction
Data journalism is a form of investigative reporting with a strong tradition in North America and Great Britain. Knight and Cook describe how data journalism has recently become something of a buzzword even though this type of storytelling is not new. The difference between data journalism and more conventional types of journalism is described in The Data Journalism Handbook as the possibilities that open up “when the traditional nose for news and ability to tell a compelling story” are combined with the tremendous amount of digital information that is now available (Bradshaw 3). A data journalist tells stories using large data sets, making sense of raw information where the difference between raw information and the final presentation of the story is apparent (Knight and Cook 55).
In Sweden this field of journalism is still fairly uncommon. Nygren et al. define data journalism as an emerging form of storytelling, where traditional journalistic work methods are blended with data analysis, programming and visualisation techniques. The basis of data journalism stories are usually large data sets, often consisting of public data or data collected with the aid of the general public, known as crowd sourcing. The practice of data journalism varies among countries, but the working methods and tools appear to be similar.
In a study of data journalists at a newsroom in Chicago, Parasie and Dagiral report that the approach to journalism used by data journalists is strongly connected to social movements in the online world. In our neighbouring country, Finland, data journalism is closely associated with the open data movement (Lehtonen). According to Lehtonen (16), the Finnish open data movement revolves around producing new knowledge and collecting profit by developing new ways of gathering, producing, visualising and analysing information. Finnish data journalists are described as intermediaries between government agencies and the general public, gathering and filtering information that needs to be made public.
The growing interest in analysing data occurs in many other contexts besides journalism. Gynnild argues that many countries are in the midst of a database revolution. Politicians, bureaucrats, academics, web developers and the general public are discovering and conquering new ground in collecting and disseminating information. The tools used in data journalism, often consisting of open source technology, and the methods used to analyse data are often the same as those of the scientists in the academic world. Many fields that previously had been clearly separated from computer science are now approaching data analysis. One of the fields with a growing interest in data analysis is digital humanities. In this case, the humanities have approached information science in much the same way as journalists currently are approaching and borrowing methods and tools from computer scientists.
Journalism studies is a multidisciplinary field in the borderland between humanities, social science and technology (computer science). Theories and methods from all these areas are used, and this multidisciplinary approach is useful when it comes to data journalism. In this paper we will discuss the current development of data journalism in Sweden using a case study of one of Sweden’s national leading data journalism departments. We will discuss how a data journalistic project or service is created at a media company. The two overarching research questions guiding this project are: What is the main objective for the data journalists when developing such a service? How is a data journalism service based on public sector data perceived by the general public?
The paper is based on a case study on the “Brottspejl”1 data journalism service. The study took place between November 2011 and February 2012. The researchers collaborated on an action research project with the Swedish Public Service television in a cross-disciplinary case study. The focus of the study, the data journalism department SVT Pejl at the Swedish Public Service Television was the Swedish market leader at the time of the study (see Section 2).
2. Background
A decade ago, in November 2003, the European Commission adopted the PSI (Public Sector Information) directive, encouraging re-use of public sector data to make it easier for third parties to create new services. In Sweden, the principle of free access to public records has historically allowed journalists and citizens access to documents handled by the authorities. Due to initiatives such as the EU commission’s Public Sector Information directive, and open-source data analysis tools, this data is becoming easily accessible not only to journalists but to the general public.Thus, as Cohen et al argue, the development of tools and techniques for analysing data as well as improved computing has recently created unlimited possibilities for making sense of unstructured data.
Strömbäck defines a journalist as someone who makes choices, and limits them (120). According to this definition, the journalist’s choices concern topic, narrative angle, sources, decisions about facts and words. Data journalism is constructed of choices, not only those previously described by Strömbäck but also the choice of variables, data sets, and methods of analysis as well as the choice of how to represent the data. Such choices are part of a more scientific approach to solving problems. Phillip Meyer argues that journalism based on large data sets, “precision journalism” as he denotes it, should use scientific methods for journalistic purposes, in order to use detect error and corrected them (245). According to Meyer, the practice of precision journalism adapts scientific method, scientific objectivity and scientific ideals to the process of mass communication (5). Meyer claims that the basic tools for a data journalist are spread sheets and database programs, from which the journalist could then move on to computer programming and the use of statistical analysis programs. Meyer emphasises that neither journalists nor scientists need to know everything about how computers operate; the computer is a tool to help someone towards their goal, and the goal in this case being “Be a journalist first, and don’t use the computer to shut out the world” (96).
One recent trend within the area of data journalism is teaming up journalists with computer scientists (Cohen et al). Cohen et al use the term “computational journalism” for the journalism created by such teams. The authors describe the challenges the computational journalism teams currently face, ranging from transforming paper-based documents into searchable repositories, transcribing collections of public video records, and applying existing technology through user interfaces to the specific needs of journalists as well as the cultural challenges when computer scientists and journalists meet. Computational journalism is just one concept describing the area; several other terms also exist.
In this paper we choose to use the term “data journalism” and define it as a form of storytelling based on journalistic research in the form of collection, compilation, processing, analysis and presentation of large data sets. This form of journalism is often presented as interactive graphics or seemingly simple interfaces for the user on webpages or in mobile publishing channels. It is usually published in combination with news articles and audio or video content or print, depending on the publishing house.
3. Brottspejl by SVT Pejl
SVT Pejl is the data journalism department of the Swedish public service television company. Figure 1 is a screen shot from the end of April 2012.
Figure 1: The Brottspejl data journalism service. SVT, 2012.
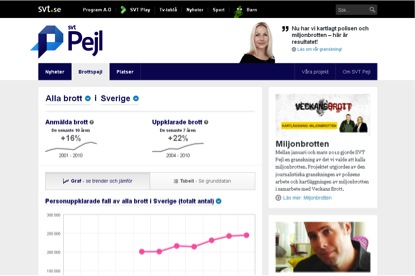
All stand-alone services developed by the department are given suffix “pejl”. Pejl is the Swedish word for “to track” (a course, for example in navigation). With five journalists and two web/software-developers, SVT Pejl was the largest Swedish data journalism department in February 2011, and one of the few existing departments focusing full-time on this kind of journalism. The stand-alone services developed by SVT Pejl have two target groups in mind: the interested citizens of society and other journalists. For the latter, preferably small to medium-sized regional media companies outside of the public service media sphere, the service can be used as a tool to develop news stories.
Over the last two years the department has won several awards and prizes, one of the most important being the prestigious “Innovator of the Year” journalistic prize in 20102 for the focus of the “Valpejl” data journalism service on the 2010 Swedish elections. Valpejl compiled data on all candidates for the 2010 parliamentary, council and county elections for in Sweden. Additionally, the service collected and presented survey responses from 2830 of these candidates. Users had the opportunity to answer the same survey as the candidates and match their responses to either political parties or specific candidates. In December 2011 the “Brottspejl” service was launched. It is based on data from the Swedish National Council for Crime Prevention (Brå), the agency under the Ministry of Justice that produces Sweden’s official crime statistics.3
4. Methods
As previously mentioned, this paper was based on a case study of Pejl, SVT’s data journalism department, and Brottspejl, their data journalism service. We used an action research approach during the case study, where one of the aims was to generate effects from the project activities. Action research is part of the qualitative research paradigm (Stringer) and its goal is to serve as a tool for solving problems experienced by people in their professional communities (12).
Yin (13) defines case studies as an “empirical inquiry that investigates a contemporary phenomenon within its real-life context, especially when the boundaries between phenomenon and context are not clearly evident”. According to Yin (78) evidence for case studies may come from documents, archival records, interviews, direct observation, participant observation and physical artifacts. The methods used for this paper are interviews and field notes, literature review, analysis of Brottspej visitor data (unique browsers and click statistics across the service) and a web survey.
The journalists working at SVT Pejl were interviewed on several occasions using semi-structured interviews. In addition, the opinions and views of the SVT Pejl journalists on the work process and the variety of available tools were collected during three workshops on data journalism, organised during the four-month period of the study and analysed afterwards.
The web survey was constructed in cooperation with SVT Pejl and the SVT analysis department. The main aim of the survey was to find out more about the current users of data journalism services. SVT Pejl can track the surfing habits of their users within the domain of SVT, but they know little about demographic variables, visitor interests and reasons for visiting the site. Therefore, a ten-question survey was designed in order to collect the views of the audience on Brottspejl – their reasons for using the service, and demographic data such as gender, age and level of education. The survey ran from the February 10 to March 11, 2012 as a pop-up web survey, embedded in the editorial blog of SVT Pejl. Due to the fact that the SVT Pejl department uses various open-source tools for their analysis work, the free version of Survey Monkey4 was used for the survey. In this version, the response rate of the survey is not included. A response rate of 18% was calculated using collected visitor data on the website and the number of responses recorded using the Survey Monkey tool. The survey sample was a random sample shown to every 10th visitor that visited Brottspejl for at least 10 seconds. The results were analysed using SPSS and may provide indications on why and how the users are interested in such a data journalistic service.
5. Results
5.1. Brottspejl, the Evolving Data Journalism Service
The in-depth interviews of this study focused on how data journalists perceive their role as journalists, what tasks they usually perform and how they present their stories to the general public. According to these journalists, they are often criticised by colleagues for spending too much time behind their desks on their computers. One of the journalists at SVT Pejl described how the difference in the working process between a traditional journalist and a data journalist is actually very small. Journalists ask questions; data journalists ask the data. The results from these queries are often used as a step in research before carrying out follow-up interviews with real people. In that sense “analysing the data” is simply one of the (new) tools of data journalism when “producing news”.
In this paper, the main focus is on the general public, and to some extent also to the journalists as users of the service. “Brottspejl”, the web-based data journalism service, was launched in December 2011 embedded in the editorial blog of SVT Pejl.The service is furthermore connected to several TV programmes on SVT, Veckans Brott, (“Crime of the week”) and the two regular daily evening news shows.
Figure 2: Screenshot of Rapport,the regular news show on channel SVT1 on the day Brottspejl was launched (15/12/2011).

On the launch date, Brottspejl was introduced on the regular evening news shows Rapport and Aktuellt. The promotion of the service was followed by news stories based on the data. These stories had been developed in cooperation between SVT Pejl, the SVT national news department and the regional departments. On one day, December 6th, the regional departments surveyed all crimes committed in their regions and produced stories about a selection of them. These stories complemented the statistics presented on the news shows on December 15th. On the day of the launch, a total of 22,300 unique visitors came to the service. The day after the launch, the number decreased to 7,321 and 3,900 unique visitors the day after that. In periods of no cross-promotion, the usage of the service is low, typically around 1,200 unique visitors a day. During the launch week a total of 45,996 unique visitors came to SVT Pejl. The entire SVT website had about 2.6 million unique visitors that week.5
During the period of the study, the regular TV shows used material from the service to create in-depth stories and to cross-promote the web-based service. As the service is part of a blog, it has evolved and new functionality has been added. After the study was finished, a semi-live feed from the Swedish Police, with weekly reports on occurrences in Sweden was added at the lower part of the page.
The web-based service, which is currently still a part of the SVT Pejl editorial blog, however infrequently updated, consists of several parts: the main part is a presentation of selected variables from the Brå data set concerning the number of crimes each year in different counties in Sweden and to what extent the police department managed to solve the crimes. The number of policemen in each area is also provided, as is demographic background information on the different counties. The data can be viewed in simple graphs or as tables. For the interested user, a few key metrics are provided and explained. The user has to select their province or county and can then compare it with national average or other provinces and counties. In this web-based context the journalists themselves do not comment the data and the results that can be obtained; they do, however, on the associated programmes. Commentary on the general results that can be obtained from the data is nevertheless provided on a general level in the web-based context, using a video clip of an interview with a Swedish professor of criminology. This interview is the one part of the service that gained the most attention when analysing the effect of the service in other media publishing channels.
A few weeks after the basic service was launched, the journalists carried out a crowdsourcing experiment. On the associated programmes and on the website, they asked the general public to contribute their own experiences and stories about reporting a crime. Users could fill out an online form and submit it as part of the service. It was then possible to manage the data as it was stored directly in a database in a pre-formatted structure. Other journalists at SVT suggested the department should consider collecting the stories through e-mail; this was never an option for the data journalism department however, as their experiences taught them that e-mail data would be unstructured and less manageable. The crowd-sourced crime stories collected were published anonymously on the service. Contributions were sorted by province and could be read verbatim by anyone. However, the main purpose of the database was for the journalists at SVT to use it as an additional data resource to find and to follow up on stories for news reports on the programmes linked to the main online crime statistics service.
Brottspejl has two main target groups. As previously mentioned, one of these groups consists of other journalists, who can use the service as a source for news stories. The other target group is the general public. Within this general target group, SVT Pejl has defined various “Personas” for the design process. For Brottspejl, SVT Pejl used a persona called “The Enthusiast”. She is a 47 year old married woman with grown up children. She lives in a suburb and works in marketing. This persona also has a quite detailed profile in terms of television habits. She uses the Internet, particularly services that are on their way to becoming mainstream. She is not an “early adopter”, rather part of the “early majority”. The Enthusiast is a heavy consumer of video-on-demand services and has a strong desire to keep up-to-date and to socialise, both in real life and through social media.
5.2. User Perceptions of and Views on Data Journalism
There were few visitors to Brottspejl during the brief time frame of the study. During that month, a total of 3,027 unique browsers were detected. The web survey for visitors to Brottspejl collected 57 responses from visitors. As only one-tenth of the visitors were subjected to the web survey, this would imply an estimated response rate of 19%, which can be considered low. However, as the metric “unique browser” is fairly uncertain due to possible cookie deletion by the users and the usage of several different computers during the day (work, home, mobile etc.), the total number of unique visitors may be considerably lower than the figure above. The survey results further indicate that three fourths of the visitors were returning visitors and one fourth of all visitors were frequent visitors. While returning visitors in itself is a desirable outcome of the service, it would also explain the low response rate in relation to the number of unique browsers during the period of the study. Due to the low response rate, the results of the web-based survey are not reliable in a general sense and can only be used as indications of how certain users react to data journalism services.
Most of the users (40%) started their visit at the SVT home page and followed links to the Brottspejl web page; the second most common way to the service was getting the link from watching Veckans Brott (30%), followed by knowing the address by heart (9%) and finding it through a search engine (5%).
The reasons for visiting the service varied; the majority wanted to get in-depth information for their own use (Table 1). One of the purposes of the services developed by SVT Pejl is to reach other journalists with the service so that they can use it as a source for news stories. The comments, however, did not imply that journalists in particular are using the service. Three of the respondents described in free text comments that they work for the police department or that someone in their family does, therefore they are interested in knowing more about the opinions of the general public on police department issues.
Table 1: Reasons for visiting Brottspejl (n=57).
| Reasons for visiting Brottspejl | Number of respondents n=66 |
| In-depth (Private use) | 24 |
| Follow up something seen on TV | 11 |
| Will discuss content with friends, family or collegues | 10 |
| Will discuss content in social media | 2 |
| Will publish information on private blog | 1 |
| In-depth (For work) | 7 |
| Do not know | 7 |
| Other | 4 |
According to the sample obtained, the majority of Brottspejl users of are men (70%). The age of the average user is 48, the youngest user was 13 and the oldest 70. People using Brottspejl are retired, IT consultants or engineers, students or journalists (Figure 3). The sizes of the occupations in the word cloud in Figure 3 indicate that there are many different occupation forms in the sample. If there had been a majority of one or several occupations, the font size of these words would have been larger than they appear in Figure 3.
Figure 3: Occupations of Brottspejl users of, based on the survey sample (n=57).

Answers translated from Swedish to English, image created using Wordle.6
The demographics obtained in the web survey sample differ in terms of gender and occupation from the target group persona “The Enthusiast “ as defined and used by SVT Pejl.
When asked about what topics the users would like to see in future data journalism services, not surprisingly the most common topic is crime (since it is the topic of the service they are using). In second place was politics (Table 2).
Table 2: Topics for future data journalism services ranked by the respondents of the Brottspejl sample (n=57).
| Rank | Topics for future data journalism services | Average level of interest, where 1 is “not at all interesting” and 4 is “very interesting”. |
| 1 | Crime | 3.5 |
| 2 | Politics | 3.1 |
| 3 | Economy (private) | 3.1 |
| 4 | Health Care | 3.0 |
| 5 | School | 2.9 |
| 6 | Environment | 2.8 |
| 7 | Business and economy | 2.7 |
| 8 | Culture | 2.5 |
| 9 | Sports | 2.5 |
The respondents expressed satisfaction in the free text comments about the service and that SVT is providing data journalism services with in-depth information, statistics and facts. They emphasised this by using expressions such as (here translated from Swedish to English) “damn good”, “very urgent topic” or “excellent”. Several comments state that the authorities are trying to cover up important facts, that these types of services can put pressure on the authorities, and that this is a way for the common people to have a voice in society. One respondent believed that the general public have little knowledge of the bad state of the Swedish judiciary. All comments are positive; one respondent, however, recognised these services as good initiatives, but that the statistics provided are barely processed. Another respondent pondered the possibility that there might be things in the data that the journalists behind the service themselves are hiding.
The respondents were further asked about their opinions on SVT using crowdsourcing techniques to get stories from the general public about crime and the police department. Again, the comments were positive, stating how it would strengthen SVT and that it would reveal the police department’s low interest in solving minor crimes. However, several respondents believed that the stories submitted had been censored by SVT. They believed that SVT was covering up facts in the stories or that the technology behind the service was poor and that it was impossible to find certain submitted stories. A few respondents were worried that the journalists would only choose stories that strengthen their news angle or their own beliefs. They were also worried about the representativeness of the submitted stories, stating that there were far too many stories about what the man on the street thinks, than the actual facts behind a news topic.
The respondents furthermore stated that the navigation of the service needs work, that the page needs to be updated more frequently, there is a need for more detail in the statistics presented, and that SVT needs to prove that they are unbiased in the matter. The respondents furthermore want to be able to see crime in each area in each city, one respondent asking the question: “Where are you most likely to be subjected to a crime in the city?” “Where is it most dangerous for women?”, “What types of violence are most common in what part of the city, such as assault, knife, gun fire and so on”. There are also encouraging comments such as “Keep on proving to us common Swedes that hope still exists for this country” and “Keep up the good work”.
6. Discussion and Conclusions
Data journalism is one example of an area in the borderlands of journalism – hard to define, and consisting of a combination of several previously separate trades and skills. Furthermore, the boundaries between analysed data and journalism are unclear. This study raises several questions for future research: What makes the compilation of data into a journalistic product? Can a journalist with a news angle in mind, simply select, clean, and present data and thus define it as journalism? Or, does the data also need supplementary journalistic analysis in text, audio, video or graphics to qualify as journalism?
The data journalists we interviewed are often criticised by fellow colleagues for spending too much time using their computers. However, the data journalists argue that the data is mainly used as a step in research and thus one of the (new) tools of data journalism used when producing news.
“Brottspejl”, the data journalism service, consists of both public data and information collected by crowdsourcing activities. The journalists believe that the crowdsourcing activities were the most popular and engaging part of the service for their audience. It would be interesting for future research to investigate how crowdsourced material can be assessed in terms of quality of the source. Can every crowdsourced piece of information, in this case stories about smaller crimes not handled by the police, actually be fact-checked?
The low response rate of the survey carried out for purposes of this study is a result in itself, reflecting the current low interest for advanced web-based journalism services available on a public broadcaster’s website such as Brottspejl. More importantly, the low rate of visitors to the SVT Pejl site highlights this problem. Keeping in mind that five journalists and two developers worked on “Brottspejl” makes the resources spent rather costly in terms of how it was received and consumed by the general public. This may, however, mostly depend on the service’s poor marketing strategy. Furthermore, it should be remembered that the material is created in part for the programmes previously described in section 5.1, and therefore the effort in total may be quite small in relation to the possible audience impact. Thurman and Schifferes (2012, 3) suggest 18 categories for the personalisation of news. Using these categories, interactive data journalism services online can be described as a form of “explicit personalisation” in the category “non-linear activities”, which includes content presented in embedded applications that immediately adapt their content and presentation to users’ input at a level deeper than navigational control. Online data journalism news services are often highly interactive, composed of several types of media elements: text, audio and video. The expected outcome is that this would increase the time spent on the site, and therefore attract future advertisers. How can you attract the audience in the first place to learn about these complex news stories? Are they ready to engage, and personalise the data by applying their own news angle to it when interacting with the service, to draw their own conclusions?
The results of the survey implied that the users were overwhelmingly happy with Brottspejl. This may be true for many of the users, but there is a possibility that those who decided to respond to the survey also had a more positive attitude in general to the service than those that declined to respond. Nevertheless, a few of the respondents questioned the journalists’ credibility in relation to their analyses. This is an area that needs more investigation. How objective is the information gathered and presented by journalists? And how is it perceived? The data may be refined and presented to support a certain journalistic story; some of the respondents, therefore, pondered whether the journalists behind the service had their own political agenda in choosing to publish certain data. The journalists at SVT Pejl believe that this type of uncertainty can be avoided if the original data, or a link to the original data source, is also included in the service. However, for ethical or legal reasons it might not always be possible to publish the raw data. How does this affect the credibility of the data journalism service, and how does it in turn affect the credibility of the providers of the raw data?
The project behind this study was an action research project, a joint collaboration across disciplines and with partner companies. The researchers in the project therefore had dual roles. We were acting both as facilitators for SVT and as scholars. Such an arrangement calls for constant compromise, which became highly apparent when constructing the survey. For both the companies and the researchers, this collaboration led to new ideas that would not have been thought up without having insight into each other’s working methods regarding the subject.
7. Acknowledgements
This study was part of the project Databasjournalistik at Södertörn University, funded by Vinnova, Sweden’s Innovation Agency. We also want to thank our research colleagues in the project: Helge Hüttenrauch, Anders Green and Tommy Larsson Segerlind. Thanks also to Jeff Skinner for proofreading and valuable comments.
8. References
Bradshaw, P. in Gray, J et al. (eds), The Data Journalism Handbook. How Journalists Can Use Data to Improve the News. Sebastopol, United States of America: O’Rielly, 2012.
Cohen, S et al. Computational Journalism. Communications of the ACM, October 2011, vol. 54, no. 10, 2011.
Knight, M and C Cook. Social Media for Journalists principles & practice. London: SAGE Publications, 2013.
Lehtonen, P. in Sirkunen, E. (ed.) Trends in Data Journalism. Next Media, Espoo, 2011.
Nygren, G, E Appelgren and H Hüttenrauch. Datajournalistik-ett växande område.” Nordicom Information 34.3-4, 2012. 81-88.
Parasie, S, and E Dagiral. Data-driven journalism and the public good: Computer-assisted-reporters” and “programmer-journalists” in Chicago. New Media & Society, 2012.
Stringer, E. Action Research. Third edition. SAGE Publications, Incorporated.
Strömbäck, Jesper. Makt, medier och samhälle. Stockholm: SNS Förlag, 2009.
Thurman, N and S Schifferes. The Future of Personalisation at News.
Websites: Lessons from a Longitudinal Study. Journalism Studies, doi: 10.1080/1461670X.2012.664341, 2012. http://www.tandfonline.com/doi/abs/10.1080/1461670X.2012.664341#.Uo4_wsS-18E
Yin, R. Case Study Research, Design and Methods. Applied Social Research Methods Series, Volume 5. Thousand Oaks, California: SAGE Publications.
- http://pejl.svt.se/brott/ (in Swedish, accessed 04/07/2012)]
- http://www.storajournalistpriset.se/kristofer-sjoholm-sveriges-television (in Swedish, accessed 04/07/2012)
- About Brå http://www.bra.se/bra/bra-in-english/home/about-bra.html (accessed 03/07/2012)
- http://sv.surveymonkey.com/ (accessed 16/08/2012)
- According to Kia Index. W51. 04/09/2012) www.kiaindex.net
- http://www.wordle.net